Kaggle Project PUBG
Team Members:
Tejas Shahpuri
INTRODUCTION

PUBG or Player Unknown Battlegrounds, available on the ps4, xbox and mobile platform, is a very popular a online multiplayer game which has over 50 million copies sold. PUBG is the 5th best selling game of all time and is developed by PUBG Corporation. In PUBG, one hundred players begin the match together. These players could either be in teams of four, two or solo. These one hundred players have to paraglide into an island, move around the map where they have to survive by finding weapons, medicines and killing their enemies. After a particular amount of fixed time for each level, the map becomes smaller by decreasing the playable area in map. This causes the players to move nearer to the hot zone of the map and meet opponents which intensifies the game action. The player or the team which is standing the last wins the match. After each game, the player or team (groupId) is evaluated on his kills in last round, team-mates revived and also how many players out of 100 were still alive when the player got eliminated(winPlacePerc). PUBG Corporation has officially made the game data available to developers using the PUBG Developer API. This helps software engineers and aspiring data scientists to explore and hunt this data to find the ideal strategy to win most of the games. PUBG or Player Unknown Battlegrounds is an open world game in which each player’s gameplay is very different. Given anonymized after match player data of over 65,000 games with more than 30 attributes or features, we will try to create a model that will predict the final placement of each of the players using final match statistics and player ratings. So what do you think is the best strategy for winning in PUBG? Is it to camp at one spot and wait for enemies or to play aggressive and rush to attack every time? Let’s find out using the data.
Reference: “https://www.kaggle.com/c/pubg-finish-placement-prediction/”
AIM
The main goal of this project is to develop a machine learning algorithm on the real world PUBG dataset captured using the PUBG Developer API to predict the the finishing rank of all one hundred players participating in the match based on their end game statistics. Also, another aim of this project is to do exploratory data analysis on PUBG game data to check out interesting findings such as which strategies tend to be most successful at winning. We will analyse different player strategies such as killing, running , driving, swimming, healing and how these strategies are correlated to the player rank (winPlacePerc). We will compare and contrast in different game modes such as solos, duos and squad. Finally we’ll try doing feature engineering to check if we can improve our accuracy using optimization. For each player or each id in the test data set, we have to predict their rank (winPlacePerc)as a percentage or probability (1 for the winner and 0 for the last player). The error or loss of our algorithm will be calculated using Mean Absolute Error between our predicted probability and given probability in the test data set.
DATA
We have PUBG or Player Unknown Battleground’s anonymized player data of over 65,000 games with more than 30 attributes or features. Kaggle has given us PUBG mobile game statistics where each row represents one player’s after game statistics. Since PUBG’s data is already cleaned and pre-processed so there is no need for it. There is no certainty that the game would begin with 100 players in every match or 4 players in every squad. Brief description of all attributes is given below:
Reference: “https://www.kaggle.com/c/pubg-finish-placement-prediction/”
ANALYSIS
In our exploratory data analysis of the PUBG real world dataset, first we will analyse different player strategies such as killing and running, which directly correspond to the attributes in the data. Also we will analyse how these strategies or attributed are correlated to the the variable we have to predict i.e player rank (winPlacePerc).
Killers:
The first strategy we will take a look at is killing. Just by looking at the bigger picture of the data we find out that the average kills a person gets in one round is approximately 0.94 players. With that, 99% of players have on average 7 or less kills in one round, while the highest number of kills recorded for any player yet is 60.
Reference: “https://www.kaggle.com/c/pubg-finish-placement-prediction/”
We will plot the PUBG data to dive deeper into Killing strategy.
Plot: Kill Counts of Players
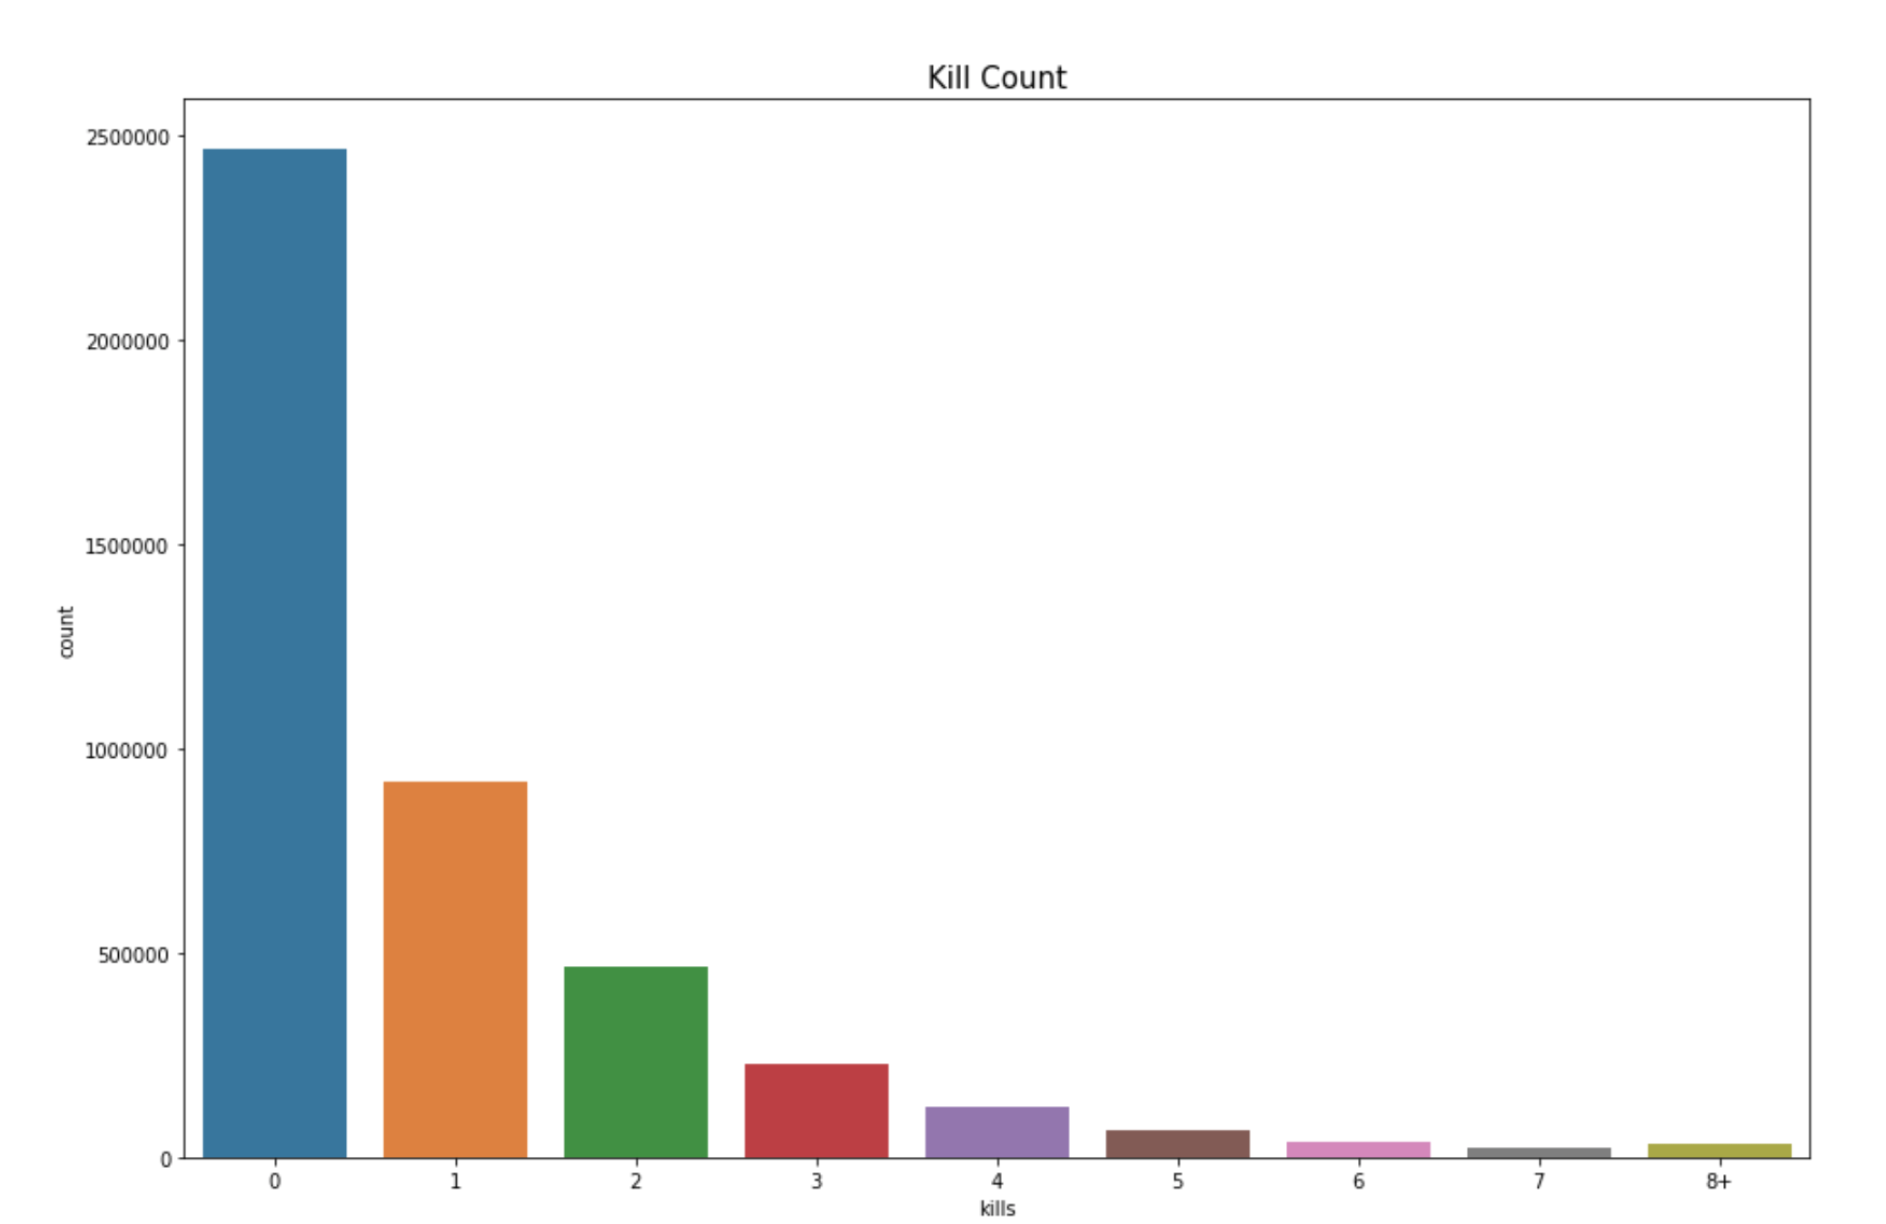
This is a count plot which reflects the distribution of the attribute “kills” (number of enemy players killed by a player). This plot shows the kill count of players. We can see here at most of the people playing PUBG struggle to even get one kill in the game. These majority people who don’t get kills, do they do some damage to the opponent?
Plot: Damage dealt by people who kill 0 people in the game
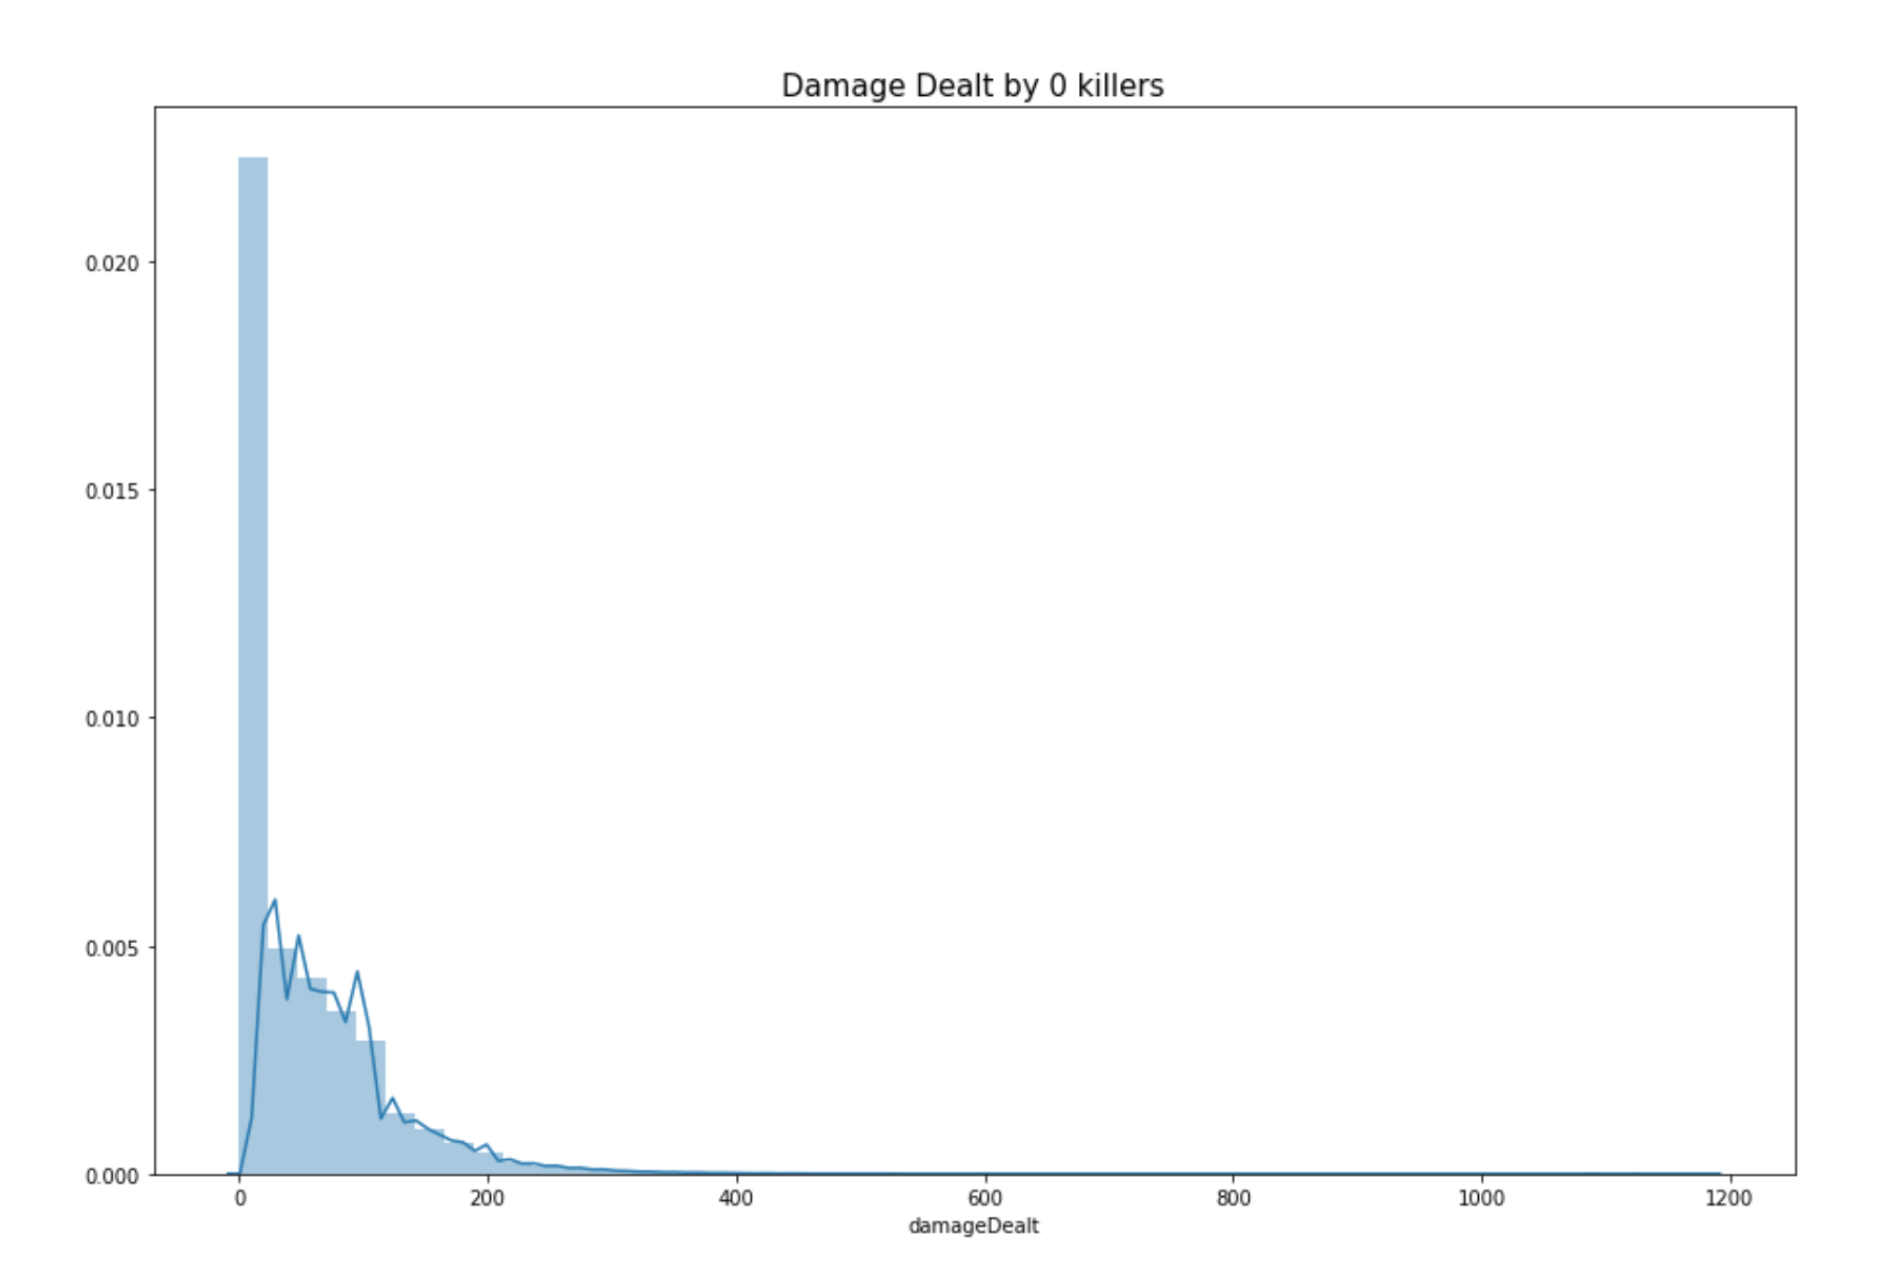
This is a distribution plot which reflects the distribution of the attribute “damageDealt” of players that get 0 kills in the game. (number of enemy players killed by a player). By looking at the chart below we see that most of the people who get 0 kills in a round don’t even do much damage to other opponents. Let’s further explore this to find exceptions. In our further data analysis for killers we find out that, 0.39% of the players in the dataset have won without a single kill. 0.11% of the players in the dataset won without dealing damage.
Plot: winPlacePerc(win placement percentage) vs kills
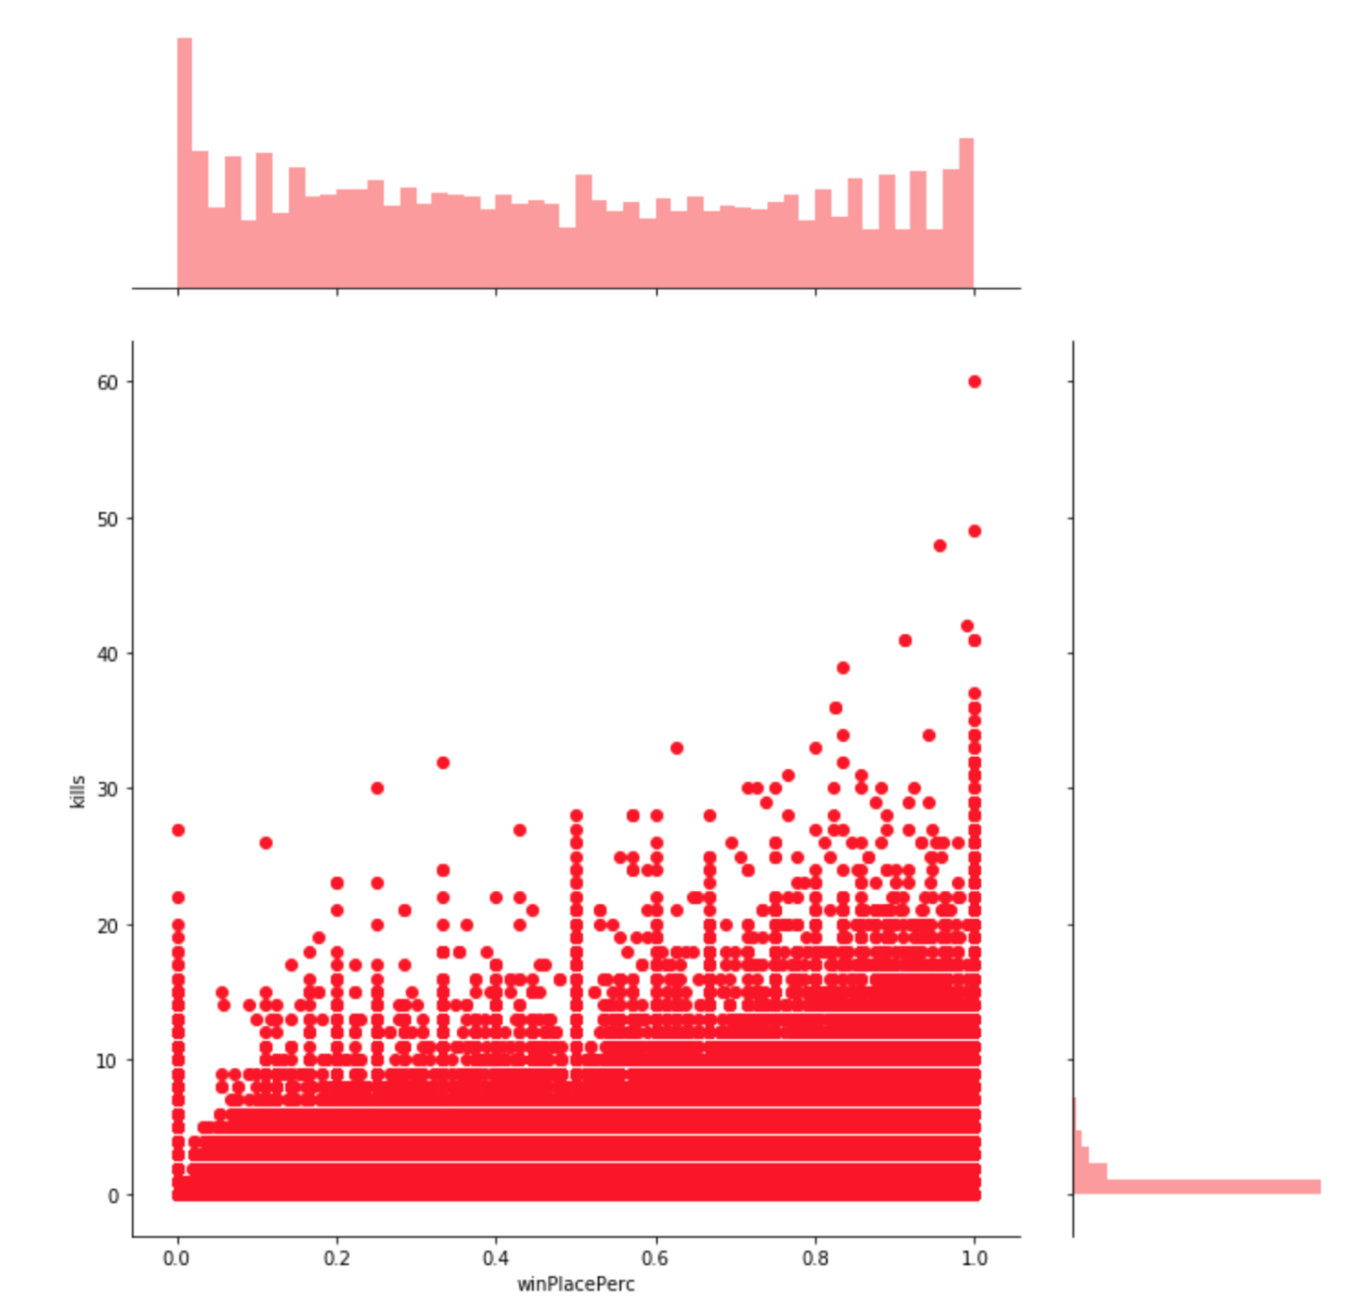
This is a joint plot which reflects the relationship between the attribute “kills” and “winPlacePerc”. By this visualization it seems very clear that killing has a correlation with winPlacePerc or percentage of winning. In order to further investigate how the attribute “kills” is correlated with the percentage of winning we create a boxplot by grouping players by kills [0, 1-2, 3-5 , 6-10, 10+].
Plot: winPlacePerc(win placement percentage) vs Kills
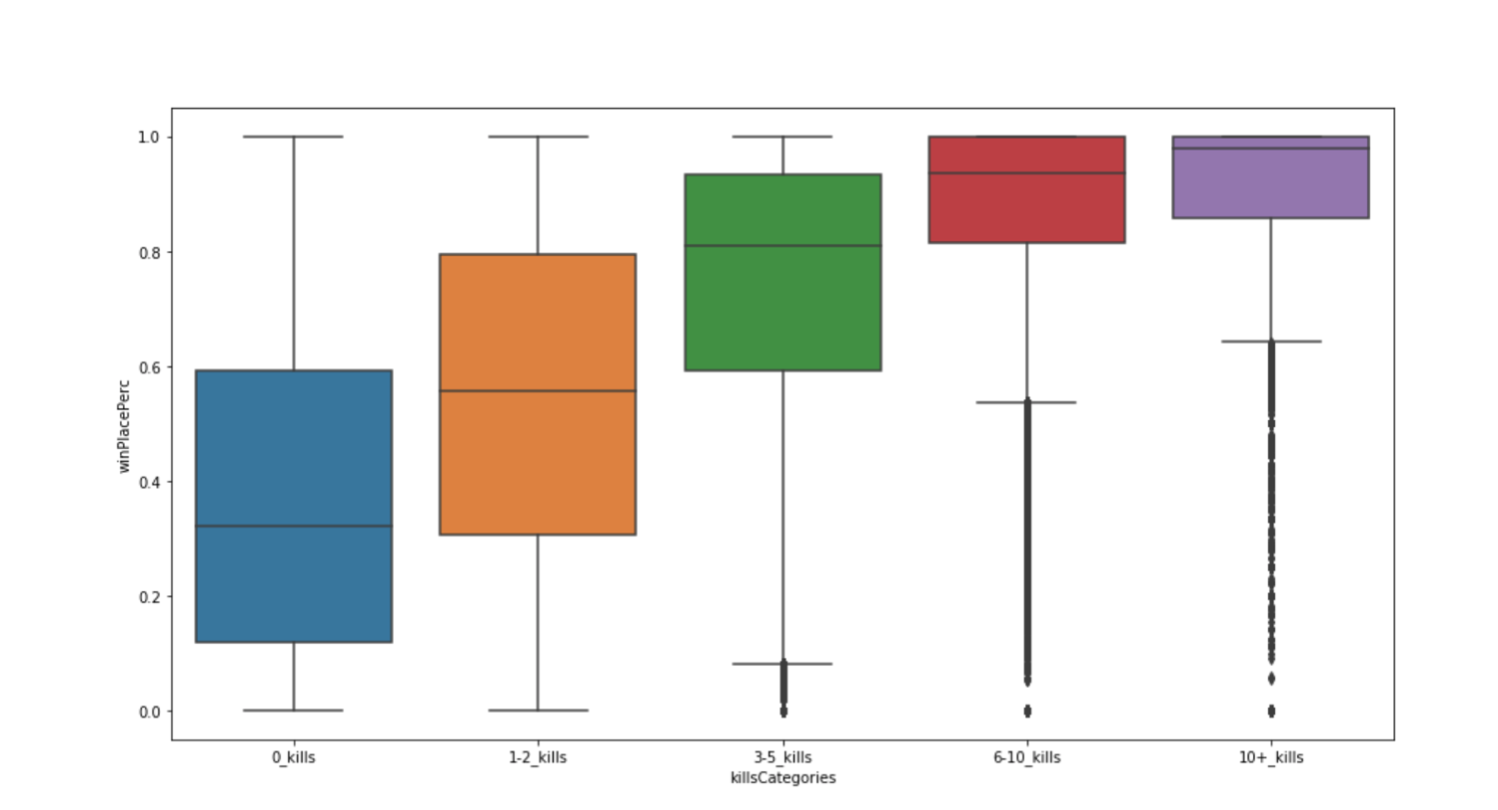
This is a box plot reflects the distribution of the attribute “winPlacePerc” (number of enemy players killed by a player). We observe that there is a positive relationship with the number of kills in a round and the percentage of winning.
Runners:
The second strategy we will take a look at is running. Just by looking at the bigger picture of the data we find out that the average distance a person walks in one round is approximately 1056 m. Also, 99% of players have on average walked 4132 m or less in one round, while the player who has travelled the most travelled 17 km. We will plot the PUBG data to dive deeper into Running strategy.
Plot: Walking distance distribution of players
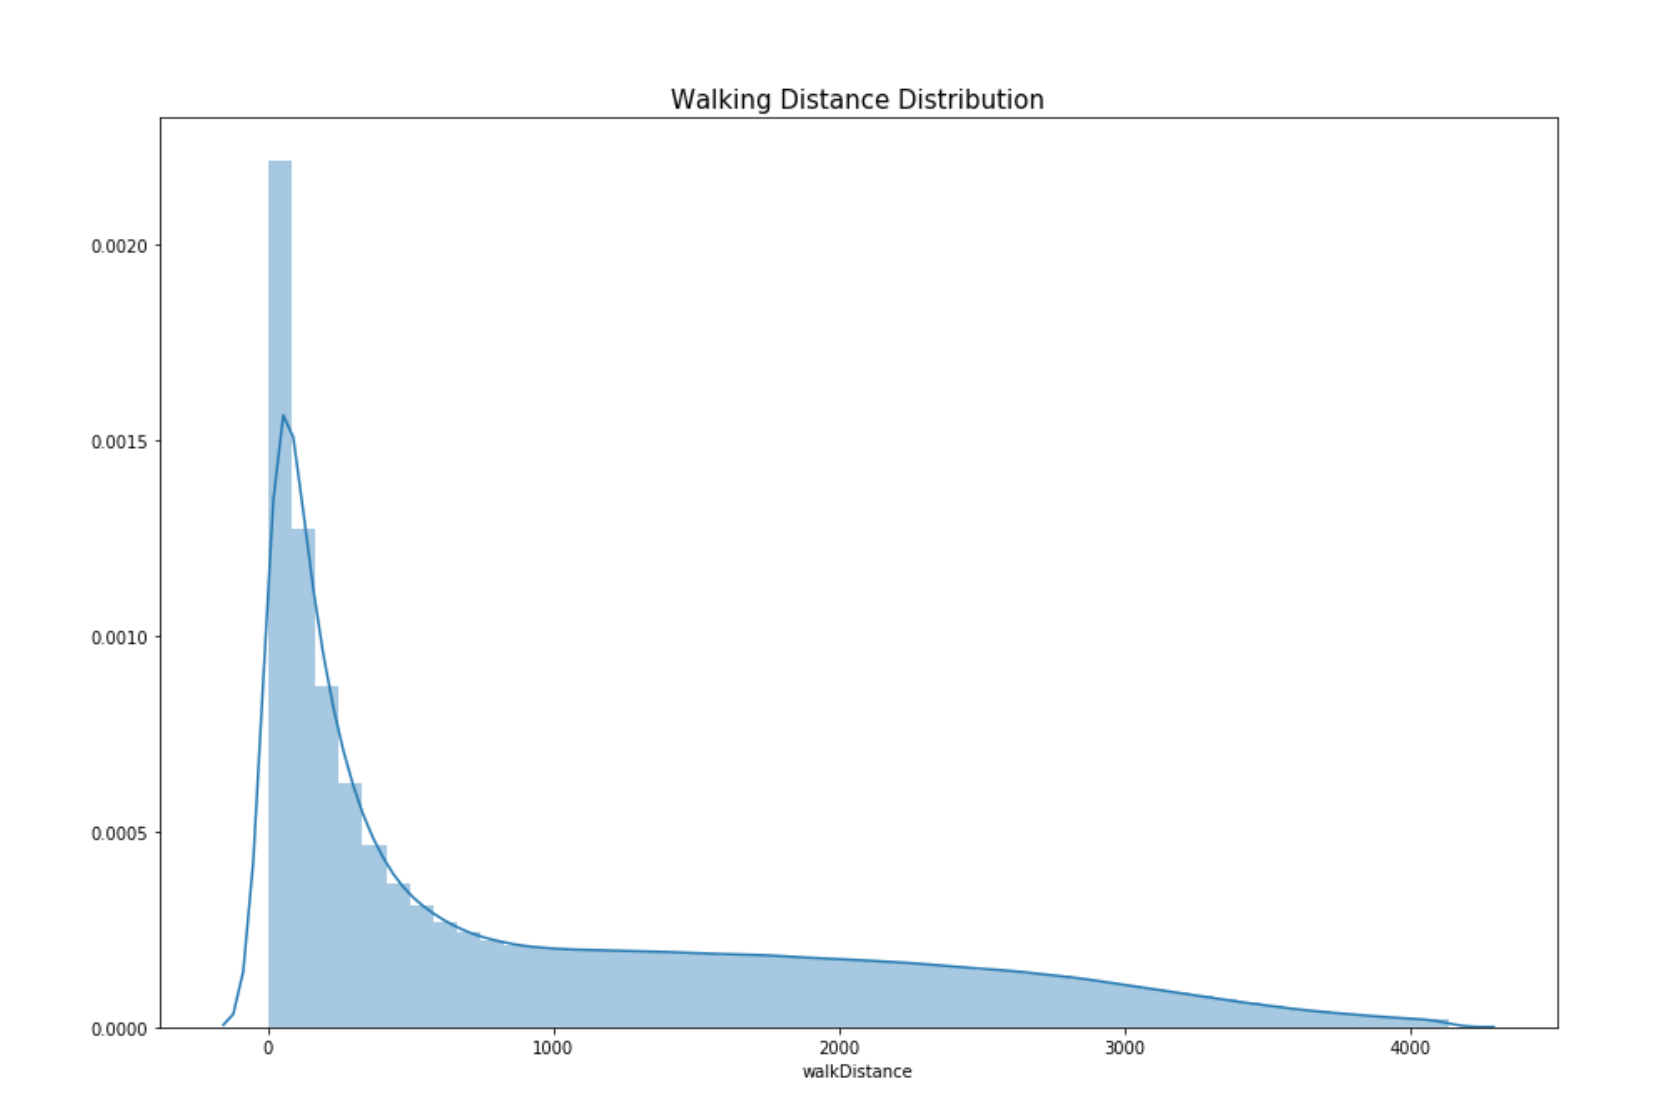
This is a distribution plot which reflects the distribution of the attribute “walking Distance” of players in the game.
By looking at the chart below we see that most of the people walk less than 1000 m in a round. Let’s further do data analysis runners. In our further analysis we found that, 2% of all the players walked 0 meters. It could mean that the players die even before landing from the parachute.
Plot: winPlacePerc(win placement percentage) vs walkDistance
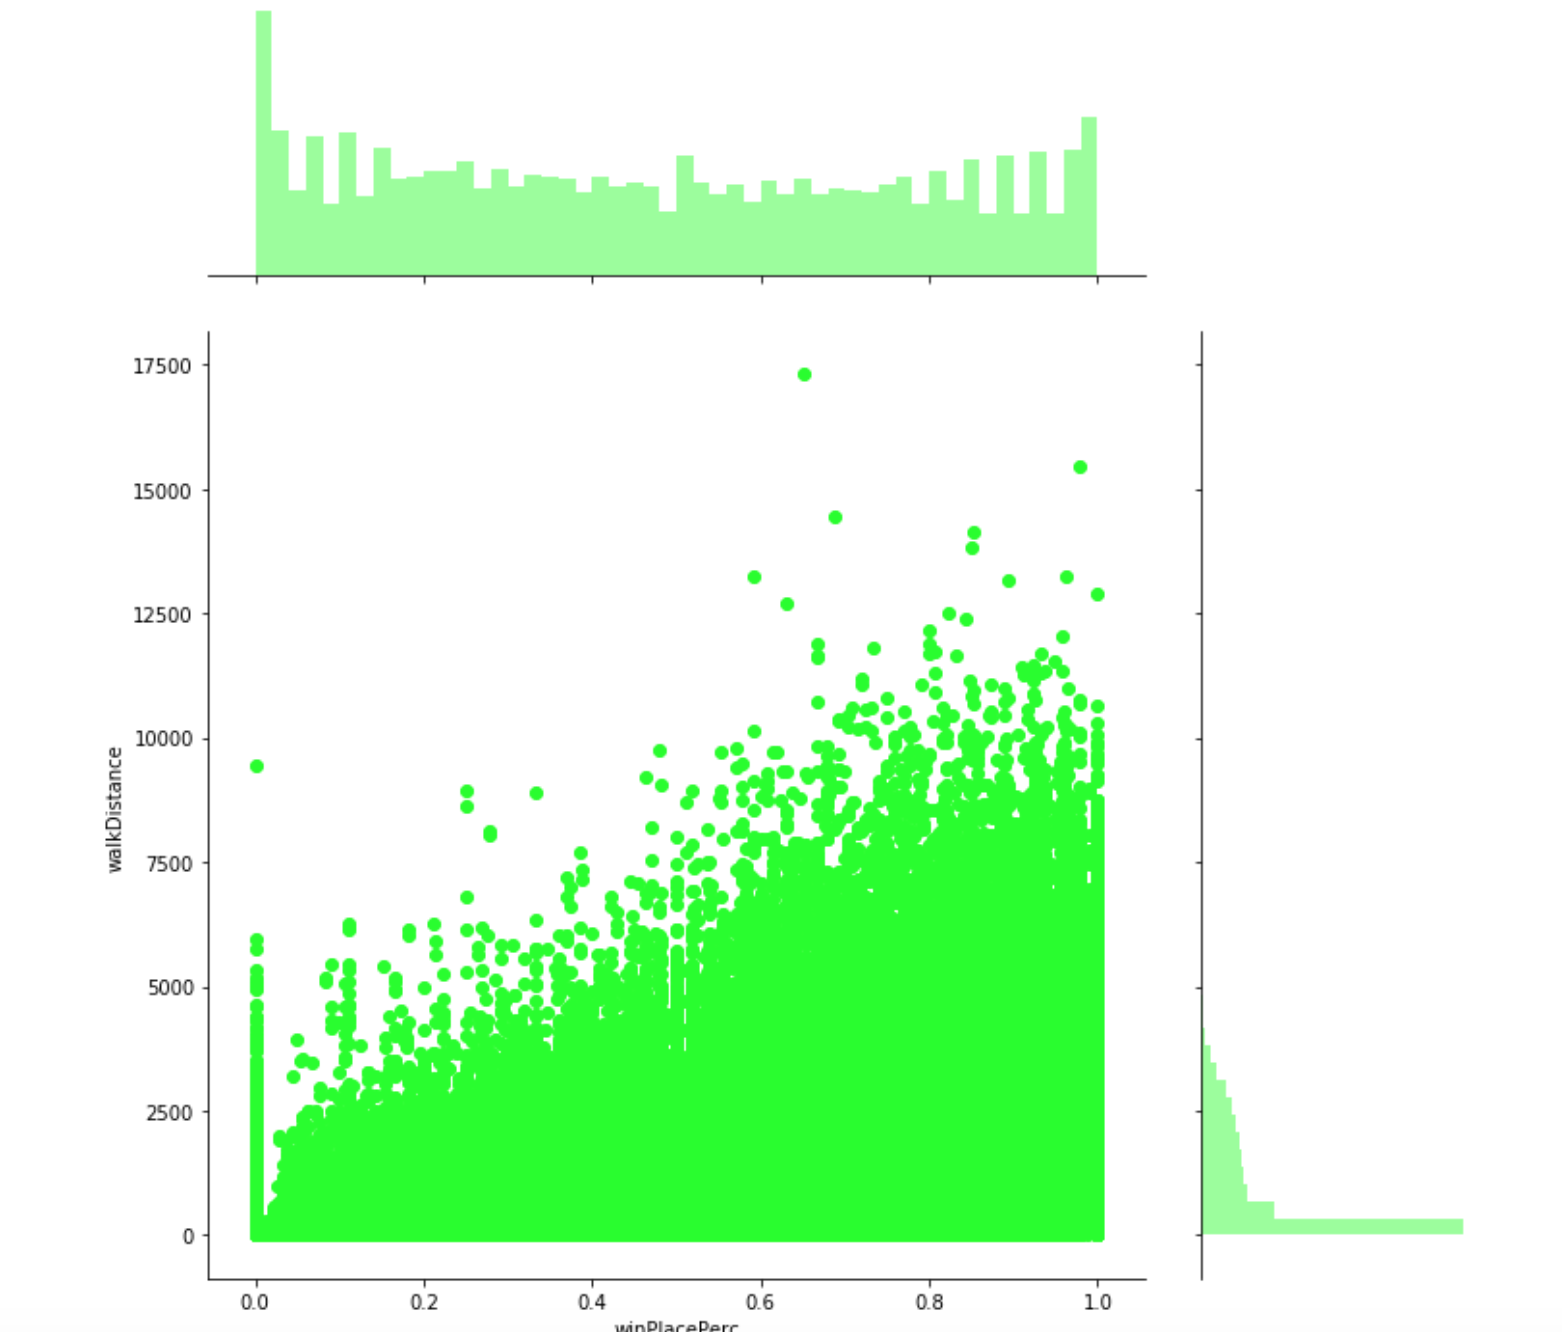
This is a joint plot which reflects the relationship between the attribute “walkingDistance” and “winPlacePerc”. By this visualization it seems very clear that walking distance has a very high correlation with winPlacePerc or percentage of winning.
Drivers:
The third strategy we will take a look at is driving. Just by looking at the bigger picture of the data we find out that the average person drives for approximately 420 m in one round. Also, one player was a rally car driver and drove for 48 km. We will plot the PUBG data to dive deeper into Driving strategy.
Plot: rideDistance of players in the game
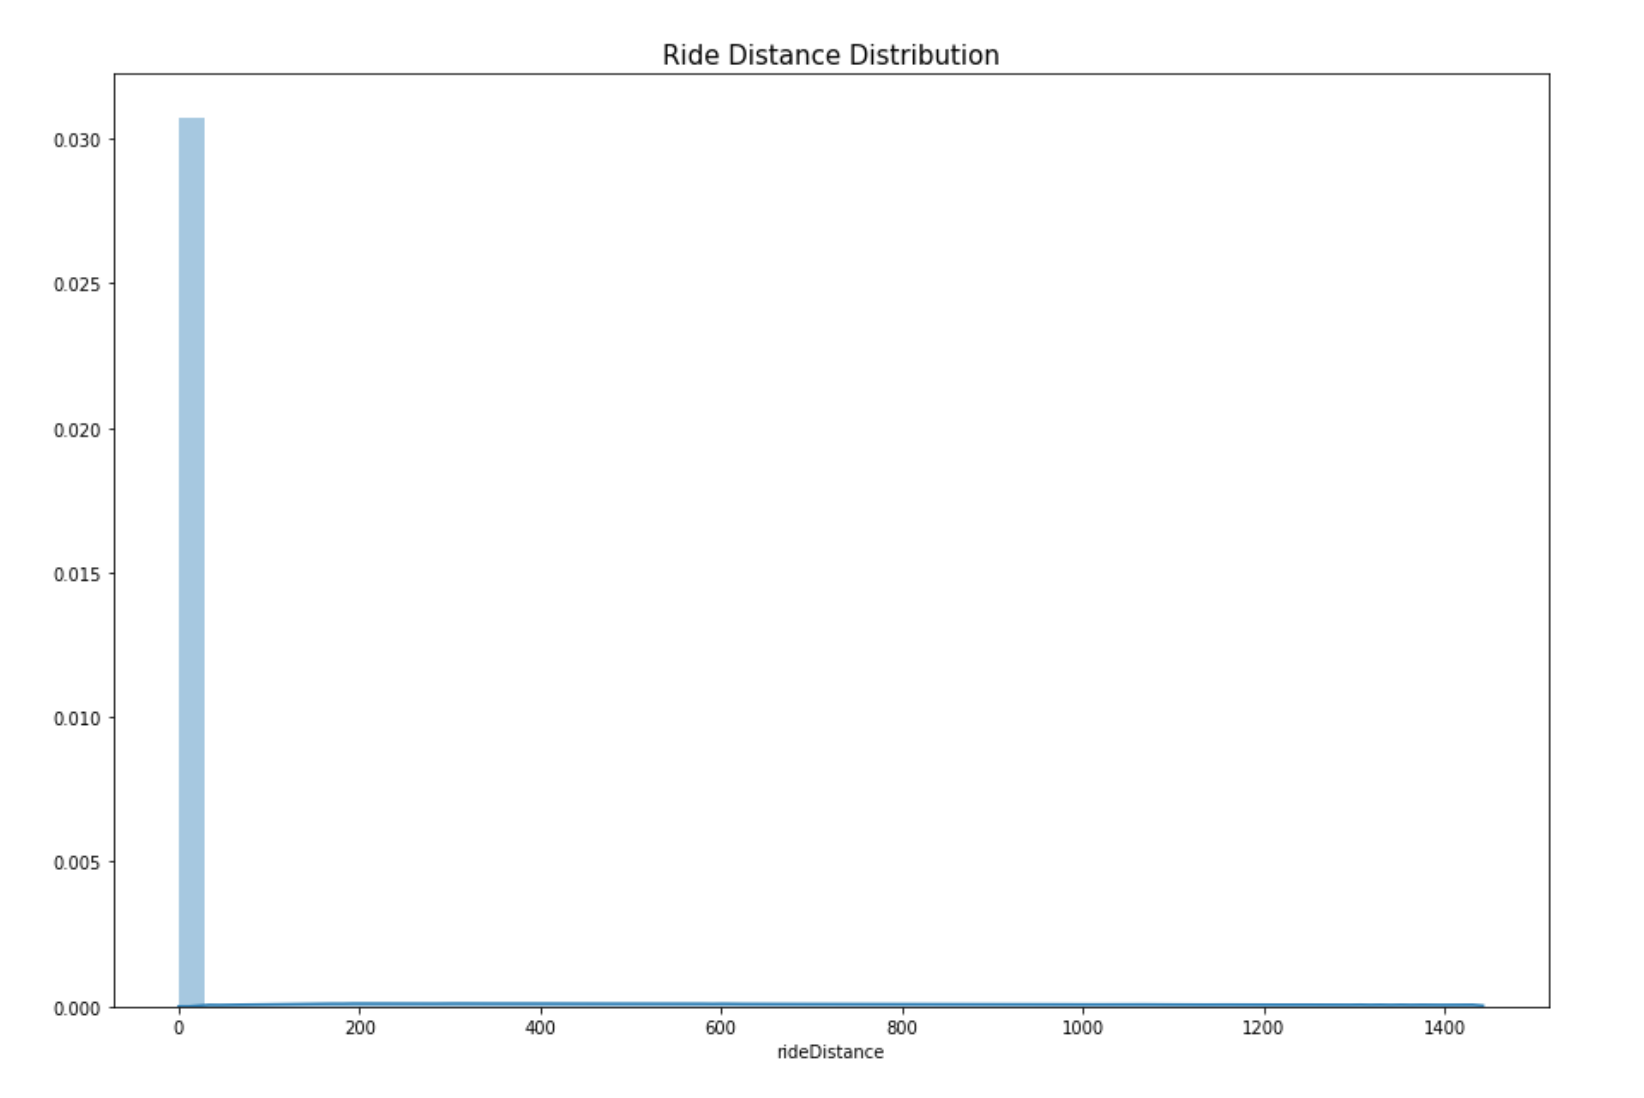
This is a distribution plot which reflects the distribution of the attribute “rideDistance” of players. By looking at the chart below we see that most of the people don’t drive or drive very less in the game. Let’s further explore this. After doing further analysis, we find that 23% of the PUBG players drove for 0 meters. This means that since ¼ of the players don’t even drive it should be an important attribute in predicting winPlacePerc.
Plot: winPlacePerc(win placement percentage) vs rideDistance
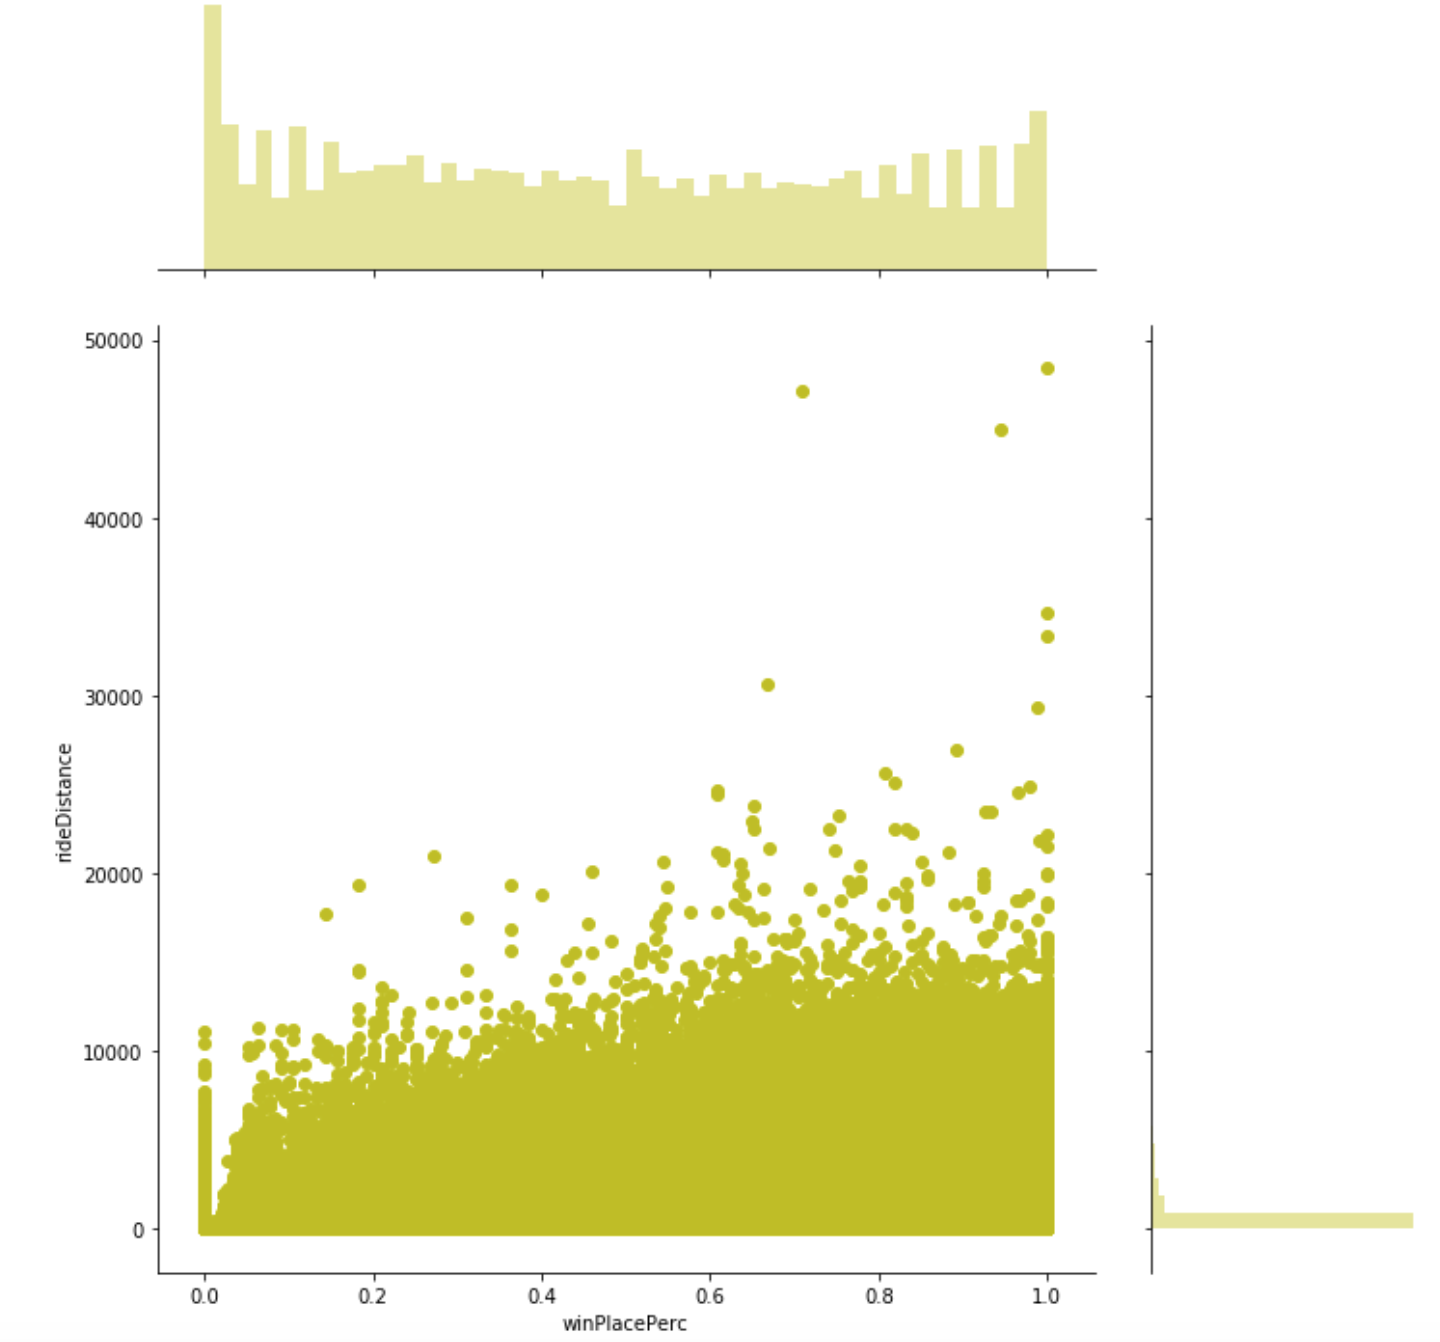
This is a joint plot which reflects the relationship between the attribute “kills” and “rideDistance”. By this visualization it seems very clear that killing has a small correlation with winPlacePerc or percentage of winning.
PREDICTION
Method:
- First we calculate the correlation to find out the whether there is relationship between attributes and the target “winPlacePerc”.
- Secondly, we would do feature engineering on the data to create 10 new attributes that would help improve our model.
- Next would be training our machine learning model on our feature set to predict the the finishing rank of players in our dataset.
CORRELATION:
Top 5 most positive correlated attributes with the winPlacePerc.
As we can see from the plot above, the top five variables which are most positively correlated with the target variable winPlacePerc are:
- “walkDistance - Total distance traveled on foot measured in meters.
- boosts - Number of boost items used.
- weaponsAcquired - Number of weapons picked up. ➔ damageDealt - Total damage dealt. Note: Self inflicted damage is subtracted.” Pearson correlation between variables:
As we can see from the plot above, the in terms of our target attribute winPlacePerc, some attributes have medium high to high correlation. The highest positive correlation was found between winPlacePerc and walkingDistance. The highest negative correlation was found between killPlace and winPlacePerc.
FEATURE ENGINEERING:
The first variable we would create would be players joined. Some of the games in PUBG isn’t full of players. We don’t know if a game has 100 players or not so we created “playersJoined” that would reflect the number of players in a game.
Plot: playersJoined distribution plot
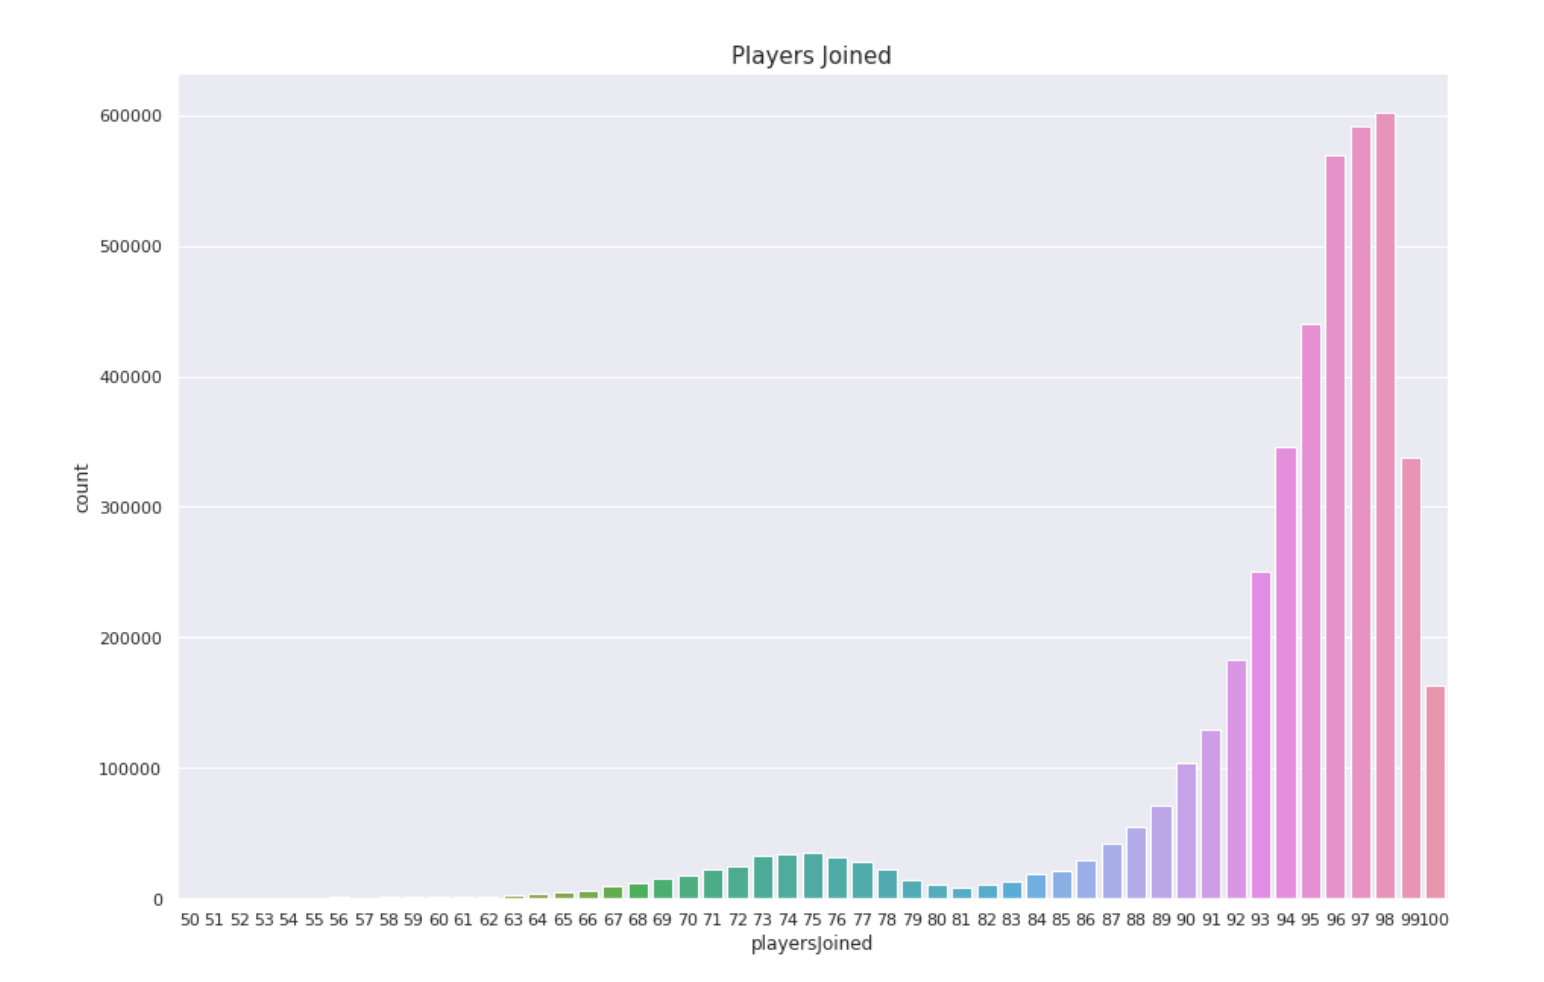
In this plot we can see that most of the games have more than 95 players. To normalize the values of other attributes we can use the “playersJoined” feature. We will create the attributes “killsNorm” and “damageDealtNorm” which will represent the normalized values for attributes “kills” and “damageDealt”. This normalization has been done since when there are 100 players in the game vs when there are 70 players it would be easier or harder to kill enemies. Let’s create some other simple features such as “healsAndBoosts” which is the sum of heals and boosts. Boosting in PUBG gives the player a boost to run faster, protect health and loot more weapons and items while healing heals a player health which has already been diminished. This also leads to more walking. So let’s create another attribute “totalDistance” which provides the sum of total distance travelled by a player. Along with this we would also need to create “healsDistance” and “boostsDistance” which would be boosts or heals per walking distance.
Let’s create another attribute “killsPerWalkDistance”. This attribute would reflect the number of kills by a player per his walking distance. This would definitely be an indicator of how dangerous a player is. We created 10 new attributes using feature engineering on attributes that are highly correlated with winPlacePerc. Now we would use the old and the new attributes as our feature set for our machine learning model.
TRAINING:
Initially I took a sample of 500,000 rows from our dataset for training our algorithm. Later on, when I have a decent accuracy I will take the full dataset and experiment with the parameters of our model. To start our training process, first we split the dataset into training and validation set. This also splits our target attribute (winPlacePer). Sample train shape: (440000, 51), Sample target shape: (440000,), Sample validation shape: (60000, 51)
The machine learning algorithm that I would use for this problem is Random Forest. Random Forest is an ensemble of many decision tree algorithms that works with both classification and regression problems. Even without tuning the hyperparameters it gives great results all the time.
Random Forest:
Random Forest is a machine learning algorithm that creates multiple decision trees and merges them together to give a more accurate prediction. In a decision tree algorithm, an input to the model enters from the top of tree or the leaf node and travels down the tree where it gets branched into smaller and smaller branches. Random Forest is an ensemble of decision tree models. Ensembles are divide-conquer algorithms in machine learning which are very useful in improving accuracy. The main point behind the working of ensemble models is many weak models can merge and create a strong model. Each decision tree is on an individual scale a weak learner and gets merged with many other decision trees to produce a strong learner or a random forest algorithm.
Feature Importance:
A great feature of random forest algorithm is feature importance. Feature importance ranks the relative importance of every attribute for the prediction. The feature importance function we use from sklearn library calculates importance of attributes by seeing how much the tree nodes, that use that attribute, amount for reduction in entropy across all trees in the random forest. Hyperparameters: Hyperparameters are important parameters that can tweaked in a machine learning model to improve the accuracy or speed of the model. The important hyperparameters of random forest for us would be:
- N estimators The first parameter would be the number of trees in the model. These number of trees is the number of trees the algorithm creates before doing majority voting or averaging. This hyperparameter on average increases the performance and makes them more composed.
-
Max features This hyper-parameter specifies the highest number of attributes a Random Forest algorithm is allowed to use in one tree.
- Minimum sample leaf This parameter specifies the minimum number of leafs that are necessary for an internal node to split. RESULTS After splitting the data into training and validation set. For the first attempt we train our first basic random forest model with the following parameters:
- n_estimators=40
- min_samples_leaf=3
- max_features=’sqrt’
- n_jobs=-1 This gives us the following results: Mean Absolute Error: Training set: 0.0392 Validation set: 0.0634 For our first try these weren’t bad results. Looks like our random forest algorithm would be able to manage to get a better error score after tweaking some hyper-parameters.
If we take a closer look into the Feature Importance table of the first attempt Random Forest we can see that the top features which are useful for the model are
- walkDistance
- totalDistance
- killPlace
Since we now know the top features for the random forest by analysing the feature importance table. This time in our second attempt for the Random Forest Algorithm we would only use the most valuable features. Second random forest model with the following parameters:
- n_estimators=80
- min_samples_leaf=3
- max_features=’sqrt’
- n_jobs=-1 This gives us the following results: Mean Absolute Error: Training set: 0.0218 Validation set: 0.0448 For our second try these were good results results. Looks like our random forest algorithm was able to manage to get a better error score after tweaking some hyper-parameters and selecting only important attributes for the model.
We take a look at the Feature Importance for this Random Forest. The top features from the feature importance table are:
- walkDistance
- killPlace
- totalDistance If you carefully compare the first and second feature importance plot you can notice some changes such as the 2nd and the 3rd most important attributes get their places interchanged. Finally after playing with hyper-parameters we found our best score. The last random forest model with the following parameters:
- n_estimators=70
- min_samples_leaf=3
- max_features= 0.5
- n_jobs=-1
This gives us the following results: Mean Absolute Error: Training set: 0.0113 Validation set: 0.0200 This is a really low absolute mean error and it makes our algorithm rank 33/988 on Kaggle.
CONCLUSION
In this Kaggle Challenge: PUBG Finish Placement Prediction, firstly we explained what PUBG as a game is and it’s different features. Then we summarized the dataset and did exploratory data analysis on PUBG game data to check out interesting findings such as which strategies tend to be most successful at winning. We analysed different player strategies such as killing, running , driving, swimming, healing and how these strategies were correlated to the player rank (winPlacePerc). Finally we’ll did feature engineering to check if we could improve our accuracy using optimization.We developed a random forest machine learning algorithm on the real world PUBG dataset captured using the PUBG Developer API to predict the the finishing rank of all one hundred players participating in the match based on their end game statistics with MAE(Mean Absolute Error) of 0.0200.
Reference: “https://www.kaggle.com/c/pubg-finish-placement-prediction/”